
“The story & Process of telling a pictorial story”
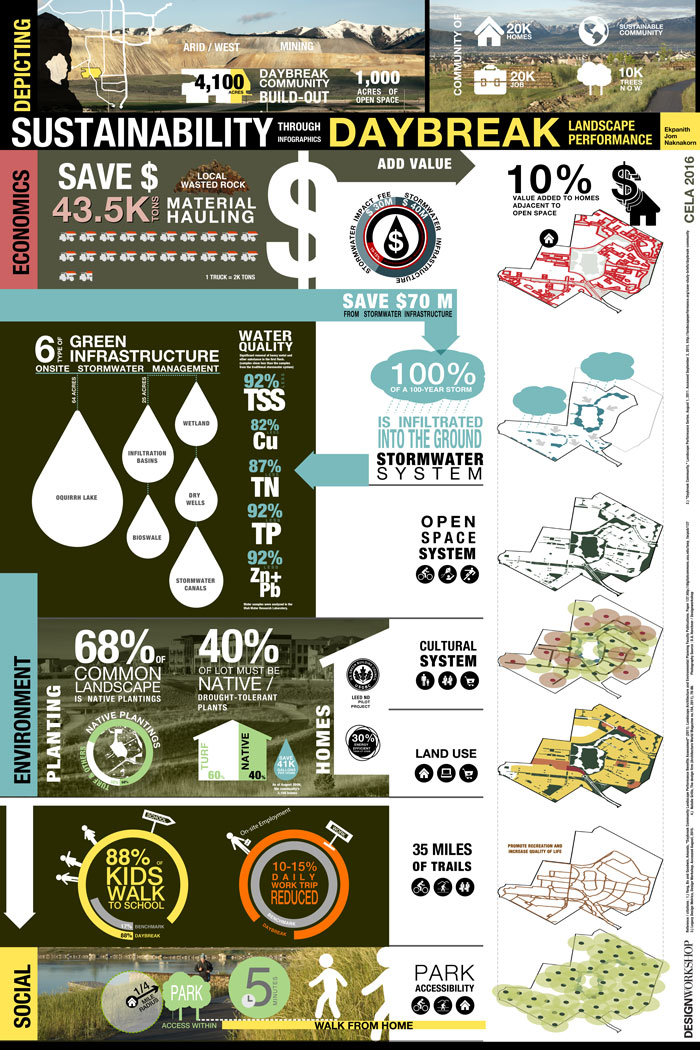
To Present at CELA 2016 (Council of Educators in Landscape Architecture), I picked Daybreak as the project to present on the Landscape Performance track. The topic of this poster is “Depicting Sustainability: Infographics Tell the Story of Daybreak’s Landscape Performance” Also, Daybreak was the first project I ever worked in United States and Design Workshop, Salt Lake City office. Terrall Budge was the principal on this project.
About this poster for CELA
This poster will summarize Daybreak’s environmental, social and economic performance based on a Landscape Architecture Foundation-funded case study by Utah State University Associate Professor Bo Yang. The infographics specially developed for this poster will graphically depict the metrics included in the case study and supplement the research of this academic team.
Objective
While the objective is to illustrate the sustainability of Daybreak and its performance, The challenge comes in the tasks of transforming the text data from narratives, research into one single poster.
In this VDO
In this coffee talk, the talk will have 2 parts.
First part, I will tell the story of Daybreak using the poster the same way I presented at CELA.
Second part will be about the process which is the 6 steps on how I translate the data into infographic.
So they are STORY + PROCESS OF TELLING PICTORIAL STORY.
Why knowing the process is important? It is easier to see, hear and understand what it is. The hard part is how to create it. So let’s start off with the story, and afterward, I would like to share the key techniques and steps of how I translate these data that full of texts into these one poster.
Part 1 : STORY
This poster is the summary of the strategies, evidence on how Daybreak design and implement the sustainability into the project.
More information about this poster and its full abstract for CELA, please go to this link on page
http://www.cela2016.com/wp-content/uploads/2016/03/proceedings-2016-final.pdf
More information about Daybreak and its landscape performance.
http://landscapeperformance.org/case-study-briefs/daybreak-community
http://www.daybreakutah.com/
Lessons Learn
I learn a lot from making this poster, and my personal goal to do this poster was to transform the sophisticated data into one single poster of infographic. I still believe in the full research data and did not intend to have this infographic to replace those valuable information. I do think this poster can serve as a tool and introduction for people to learn more about these research before going into the detail later on.
Part 2 : PROCESS OF TELLING PICTORIAL STORY
So from this data, to this graphics. I have simplify them into 6 steps. You can learn about their full description in the video.
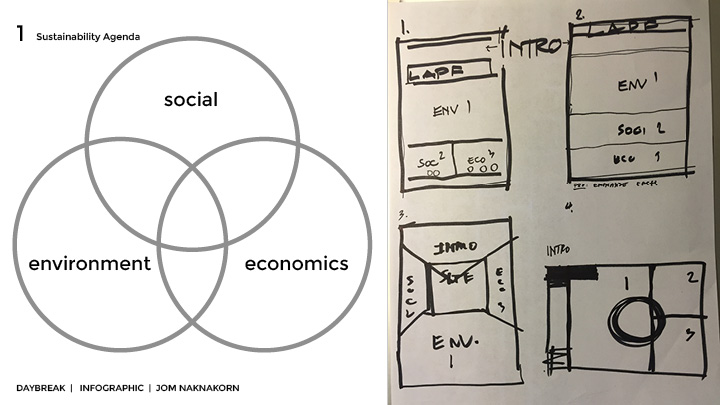
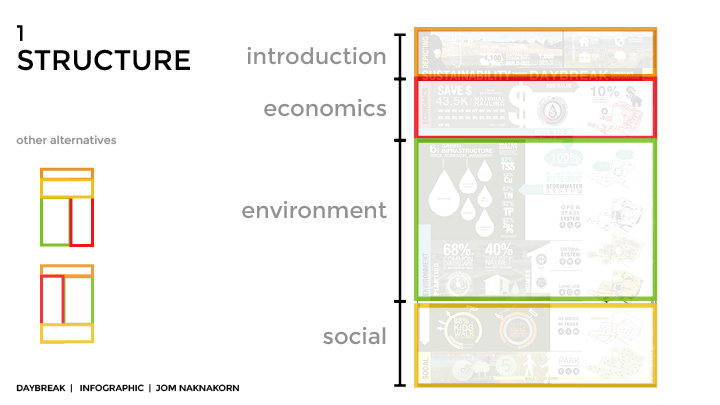
Step one. Create Structure from an objective.
Get the objective right, form a simple short and clear narrative. Why we need this poster? Why it has to be born. “It is to tell the sustainability of Daybreak. How we define sustainable ability? Yes, from this 3 rings, 3 categories that integrated together. Then this is the framework or the steps of from the objective, I know, we need to define information into 3 boxes. I call it boxes because from now on , my role is to turn everything into picture.
Result : I got 3boxes, 3 parts, I don’t know yet how I will layout, but I will think about it later.
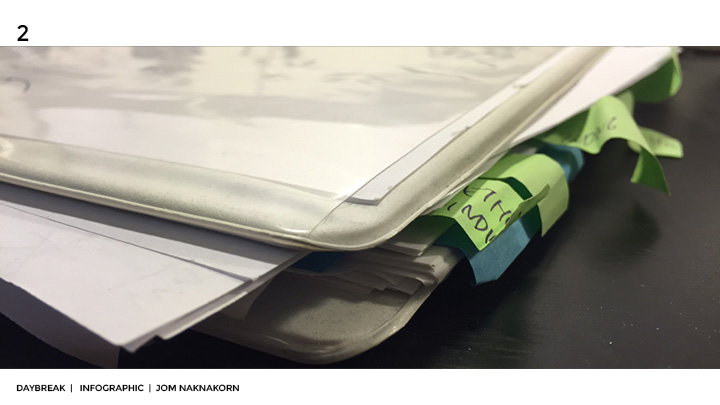
Step two. Read + Skim
Read and try to understand all the story, tie them together. Get the big picture in my head of what Daybreak is.
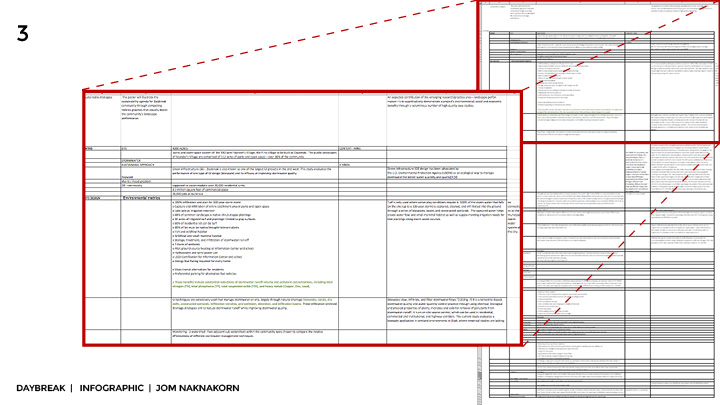
Step three. Organize.
Summarize those data.
Organize these ocean of information extract them into matrix that is closest to the boxes on step one as much as possible. I had 3 boxes. Within 1 box, I created the sub-category to throw the data in. once I find some data that outside those box, I place them in the 4th box call generic / introduction.
Step four. Prioritize / Trim the fat / get the LEAN narrative.
In these data there are some keys to focus, Highlight the key story that are crucial to show as a success of Daybreak. If it is so so, can be missed. Put that into a secondary category. But I come up with the new narrative, on how I want to talk from top to the bottom, or start to the end.
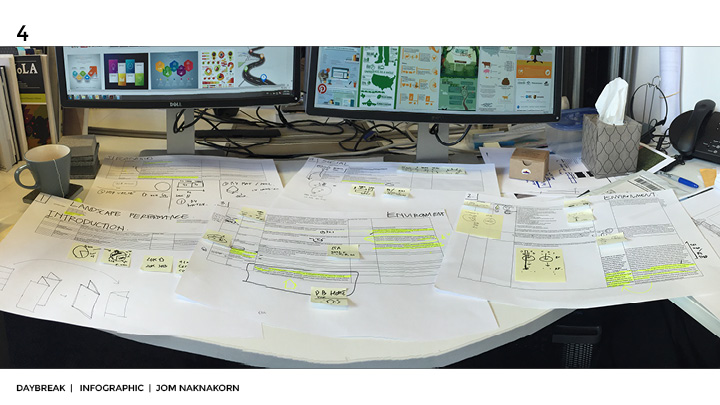
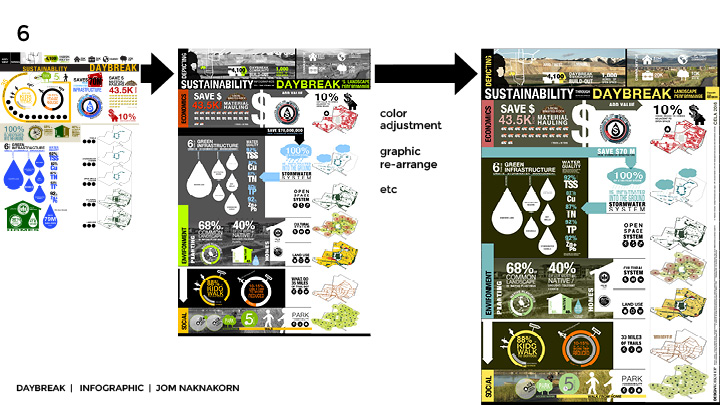
Step Five. Visualize.
Here is the fun part and it took 70% of the time to come to this stage.
Step Six. Final-Tune.
Make the story flow seamlessly, and also make a beautiful graphic that is agreeable to the eyes.
Last step, do the fine-tune of the overall, and sometimes it is important to go back and forth between step 5 – 6 to create the strong cohesive story.
I did both rearrange the location, sequence, the graphic itself, even the color.
Summary
 Visualization is not just about make a pretty graphic itself or just having good eyes or good taste.
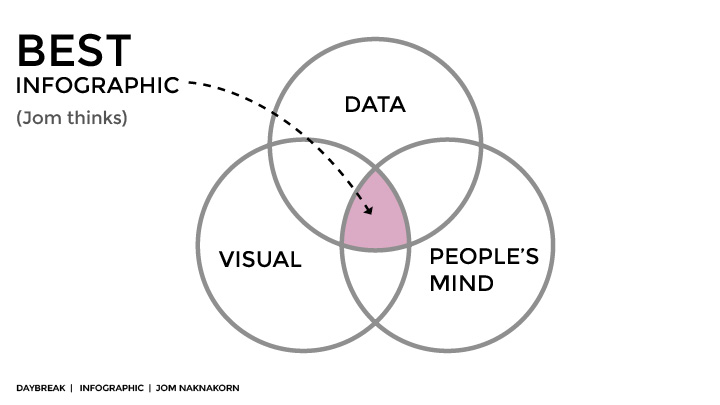
It is about organizing your mind, your data, also the brain of the audience, how they perceive the data. People natually “don’t want to think: they want to know it right-a-way once they see it. So, my role is to make the connection of those data, to the people.
Creating infographics to me is about, find this sweet spot of Data / Visual / People’s mind but in my way.
Reference :
1.) Yang, Bo and Goodwin, Amanda, “Daybreak Community Landscape Performance Benefits Assessment” (2011). Landscape Architecture and Environmental Planning Faculty Publications. Paper 137.
http://digitalcommons.usu.edu/laep_facpub/137
2.) “Daybreak Community.” Landscape Performance Series. August 1, 2011. Accessed September 3, 2015.
http://landscapeperformance.org/case-study-briefs/daybreak-community
3.) Legacy Design Metrics, Design Workshop. Accessed August, 2015.
4.) Natalie Grillo, The design firm (Architecture World Magazine no.154, 2011), 78-86.
5.) DesignWorkshop
6.) Photography : D.A. Horchner / Design Workshop